
K-1 Visa Statistics: Top Countries & Approval Rates (2025)

K-1 Visa Statistics: The Real Numbers Behind International Fiancées
The K-1 visa, often called the “fiancée visa,” is the official path for a U.S. citizen to bring their foreign partner to America for marriage. While media portrayals often focus on sensational stories, the reality is a story told through data—a story of thousands of successful global relationships each year. For men serious about finding a wife abroad, understanding these numbers provides a clear and realistic picture of the landscape.
We’ve compiled the most current and relevant data from sources like the U.S. Department of State and USCIS to create this 2025 report. This is a data-driven look at the facts behind international fiancées, from the top countries of origin to the realities of visa approval rates.
The K-1 Visa: A Brief Background
Before diving into the numbers, it’s helpful to understand the purpose of the K-1 visa and how it compares to other family-based immigration paths. This context clarifies why thousands choose this specific route each year.
What is a K-type Visa?
A “K” visa is a category of nonimmigrant visa issued by the United States to the fiancés and spouses of U.S. citizens, along with their minor children. While it’s classified as “nonimmigrant,” it is unique because it explicitly allows for “dual intent”—the holder enters temporarily but with the clear, legal intention of applying for permanent residency (a Green Card) after fulfilling specific requirements.
Fiancé & Spousal Visa Types
Couples have a few primary options for bringing a foreign partner of a U.S. citizen to the U.S. The path they choose depends on whether they are already married.
- K-1 Visa (The Fiancée Visa): For a foreign partner who is not yet married to a U.S. citizen. The couple must marry within 90 days of the K-1 holder’s arrival. After marriage, the foreign spouse applies for Adjustment of Status.
- K-2 Visa: For the eligible, unmarried children (under 21) of a K-1 visa applicant.
- CR-1 Visa (Conditional Resident Visa): A spousal visa for those married to a U.S. citizen for less than two years. The foreign spouse enters the U.S. with a 2-year conditional Green Card. The couple must later petition to remove the conditions.
- IR-1 Visa (Immediate Relative Visa): A spousal visa for those married to a U.S. citizen for two years or longer. The foreign spouse enters the U.S. with a 10-year permanent Green Card without conditions.
Why Do K-1 Visas Exist?
The K-1 visa was created to solve a specific logistical and legal problem for international couples. A standard tourist visa (B-2) cannot be used if the person has a preconceived intent to immigrate, which would be visa fraud. The K-1 visa provides a legitimate pathway for couples to unite and marry in the U.S.
Key K-1 Visa Trends 📈
The landscape of K-1 visas is constantly evolving. Here are some of the most important current trends:
- Processing Time Volatility: Since 2020, processing times have seen significant fluctuations. While pandemic-related backlogs are slowly clearing, wait times for both USCIS petition approval and embassy interviews can still be lengthy and unpredictable. This has led some couples to re-evaluate their options.
- The “CR-1 Shift”: Due to K-1 processing delays and the fact that a K-1 holder cannot work until they receive an Employment Authorization Document after marriage, many couples are now opting to marry in the fiancée’s country and apply for the CR-1 spousal visa instead. While the CR-1 process itself can be long, the foreign spouse arrives in the U.S. as a permanent resident, with the right to work immediately.
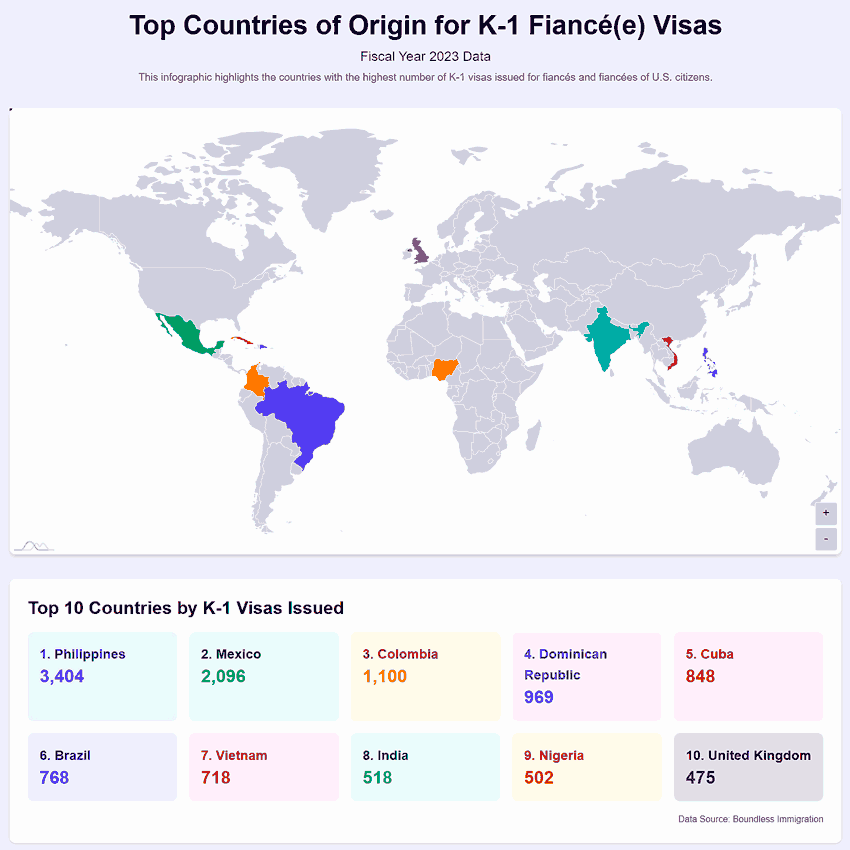
- Geographic Concentration: The sources of K-1 visas remain highly concentrated. Asia (led by the Philippines and Vietnam) and Latin America (led by Colombia, Mexico, and Brazil) consistently account for the vast majority of all K-1 visas issued, a trend that shows no sign of changing.
 Resource: USCIS: Immigration and Citizenship Data
Top 20 Countries for K-1 Fiancée Visas
The Philippines remains the undisputed number one source country, but the list reveals a diverse mix of nations from around the globe.
| Rank | Country | Illustrative Annual K-1 Visas |
|---|---|---|
| 1 |  Philippines Philippines | ~7,000 |
| 2 |  Colombia Colombia | ~1,500 |
| 3 |  Vietnam Vietnam | ~1,400 |
| 4 |  Mexico Mexico | ~1,300 |
| 5 |  Brazil Brazil | ~1,200 |
| 6 |  United Kingdom United Kingdom | ~1,100 |
| 7 |  China China | ~950 |
| 8 |  Dominican Republic Dominican Republic | ~900 |
| 9 |  Ukraine Ukraine | ~850 |
| 10 |  Thailand Thailand | ~800 |
| 11 |  Canada Canada | ~750 |
| 12 |  Germany Germany | ~650 |
| 13 |  Nigeria Nigeria | ~600 |
| 14 |  South Korea South Korea | ~550 |
| 15 |  India India | ~500 |
| 16 |  Jamaica Jamaica | ~480 |
| 17 |  Japan Japan | ~450 |
| 18 |  Australia Australia | ~420 |
| 19 |  Haiti Haiti | ~400 |
| 20 |  Russia Russia | ~380 |
Note: Numbers are illustrative, based on recent historical averages from the U.S. Department of State and can fluctuate annually. Data Source: Boundless Immigration.
K-1 Visa Approval & Denial Rates
Many men worry about the possibility of a visa denial. However, the data shows that for couples with a genuine, well-documented relationship, the approval rates are overwhelmingly positive. Denials typically do not happen at random; they are almost always caused by specific issues.
Fact: Historically, the approval rate for K-1 visas for petitioners with no red flags and strong evidence is often around 80-90%. The most common reasons for denial are a lack of proof of a “bona fide” relationship, or “inadmissibility” issues with one of the applicants. This is why proper preparation is so critical.
Success Rates of International Marriages
A persistent myth is that international marriages are unstable. The data suggests the opposite. According to various studies and surveys, the divorce rate for intercultural marriages is often significantly lower than the domestic divorce rate in the United States. This is often attributed to the strong commitment required to get through the immigration process and the shared traditional values of many couples.
Studies have shown that men who marry foreign-born women report higher levels of marital satisfaction and lower rates of divorce compared to the general population.
The visa process is complex, but the data shows it is a reliable path to love for thousands each year. Get all the details in our main hub.
K-1 Visa Statistics FAQ
Where does this K-1 visa data come from?
Official statistics on visa issuance are published annually by the U.S. Department of State and U.S. Citizenship and Immigration Services (USCIS). This report is a compilation of this publicly available data.
Why is the Philippines always the #1 country for K-1 visas?
This is due to a unique combination of factors: a large, English-speaking population; a pro-American culture; the strong appeal of Filipina women’s traditional values; and a long history of successful marriages between Filipinas and American men.
Are the approval rates the same for every country?
No, they can vary. Countries with higher rates of attempted immigration fraud may face more scrutiny from consular officers, which can lead to slightly lower approval rates or more requests for evidence (RFEs).
What is the average age difference in these relationships?
While every couple is different, data trends show that the average age gap in a U.S. man/foreign woman marriage is often between 5 and 15 years, typically with the man being older.
Do more men or women receive K-1 visas?
The K-1 visa is overwhelmingly issued to female fiancées of male U.S. citizens, accounting for more than 90% of all K-1 visas issued.
How do these numbers relate to the term “mail order brides”?
The term “mail order bride” is outdated and inaccurate. These numbers represent real relationships formed between consenting adults through modern international dating platforms. Our article on the mail order bride myth vs. reality explains more.
Why have visa numbers changed over the years?
K-1 visa numbers can be affected by many factors, including global events (like the COVID-19 pandemic which caused massive backlogs), changes in U.S. immigration policy, and processing delays at embassies.
Which U.S. states do most K-1 visa holders move to?
The states with the largest populations and significant immigrant communities, such as California, Texas, Florida, and New York, consistently receive the highest numbers of K-1 visa beneficiaries.
How do K-1 visa numbers compare to CR-1 spousal visa numbers?
The number of CR-1 spousal visas issued is typically much higher than K-1 visas. Many couples choose to marry in the fiancée’s home country and file for the CR-1 visa, as it grants immediate permanent residency upon arrival in the U.S.
Are the statistics different for same-sex couples?
Same-sex couples are eligible for the same K-1 and CR-1 visas. While the total number is smaller than for opposite-sex couples, the process and requirements are identical.
The Data Tells a Story of Success
While every couple’s journey is unique, the statistics show a clear and consistent trend: international dating is a successful path to a lasting and happy marriage for thousands of Americans every year. The numbers don’t lie—global love is thriving.